
The hidden bias in judging
I’ll never forget watching a local pie-baking contest a few years ago. Old Man Hemlock, famous for his apple pie, lost to a newcomer whose blueberry creation looked…well, a little messy. The uproar was immediate. Everyone felt it was unfair, a snub to tradition. But what is fair? It got me thinking about how deeply ingrained bias is in evaluation, even when people are trying their best.
We all have cognitive biases – mental shortcuts that influence our judgments. Confirmation bias leads us to favor information that confirms our existing beliefs. Anchoring bias makes us overly reliant on the first piece of information we receive. The halo effect causes our overall impression of a person to color our assessment of their specific skills. These aren’t character flaws; they’re just how our brains work.
This happens everywhere. In sports or art shows, a single person's mood can change someone's career. Even the California courts have specific rules to stop judges from letting personal feelings leak into their rulings. The goal is always the same: keep irrelevant noise out of the final score.
It’s easy to assume bias is always malicious, a conscious attempt to favor one competitor over another. But most of the time, it’s unconscious. It’s the result of our brains trying to make sense of a complex world with limited information. Recognizing this is the first step toward mitigating its effects.
Why scoring scales fail
Traditional judging often relies on scales – 1 to 10, Excellent to Poor, or similar. The problem is, these scales are fundamentally subjective. What does a "7" mean? It's entirely up to the individual judge’s interpretation. One judge’s "7’ could be another’s ‘5’ or ‘9".
Think about a debate competition. A criterion might be "delivery.’ What constitutes ‘good delivery’? Pace? Volume? Eye contact? Without clear, objective anchors, judges will focus on different aspects, leading to inconsistent scoring. You’ll see this in art competitions too – ‘originality" is a lovely concept, but incredibly difficult to measure consistently.
I’ve seen cooking competitions where judges praise "flavor balance’ without defining what that means. Does it mean a harmonious blend of sweet, sour, salty, and bitter? Or something else entirely? This ambiguity allows personal preferences to creep into the evaluation, undermining the fairness of the contest. It’s not about the judges being bad judges, it"s about the limitations of the system.
- Scales vary wildly because every judge interprets a '7' differently.
- Lack of clear anchors: No universal definition of scoring criteria.
- Personal preference creeps in: Ambiguity allows for biased evaluations.
Using behavior as a yardstick
What if we could shift the focus from perception to observable behavior? That’s the core idea behind using analytics to mitigate judging bias. Instead of asking judges to assess "creativity,’ we track the number of unique ideas generated. Instead of evaluating ‘effort," we measure the time spent on a task.
This isn’t about replacing judges entirely. It’s about providing them with objective data points to complement their subjective assessments. By focusing on what competitors do, rather than how judges perceive them, we can reduce the influence of bias. For example, in a coding competition, we can track lines of code written, number of bugs fixed, and test cases passed.
Consider a public speaking contest. Instead of solely relying on a judge’s impression of "charisma,’ we could analyze the speaker’s use of pauses, vocal variety, and body language (using tools that analyze video data, for instance). This data doesn"t define a good speaker, but it provides additional information for the judges to consider.
The goal isn’t to eliminate subjectivity, but to balance it with objectivity. It’s about creating a more transparent and defensible evaluation process. It's about moving beyond 'gut feeling' and grounding judgements in evidence.
Building rubrics for data
The key to successful data-driven judging is designing a rubric that allows for analytics integration. This means breaking down complex criteria into measurable components. Instead of a vague criterion like "taste" in a cooking competition, we need to identify specific, observable elements.
Let’s continue with the cooking example. Instead of "taste,’ we might score ‘balance of flavors’ (on a scale of 1-5, based on the presence of sweet, sour, salty, umami), ‘texture’ (crispy, creamy, chewy – again, a defined scale), and ‘aroma" (intensity and complexity). Each element is still assessed subjectively, but the criteria are much more specific.
The rubric should clearly define what constitutes each score level for each element. A "5’ for ‘balance of flavors’ might mean ‘perfectly harmonious blend of all five tastes.’ A ‘1’ might mean ‘significant imbalance, one or more tastes overpowering." This provides judges with a common framework for evaluation.
It’s important to remember that not everything can be quantified. Some criteria will always require subjective judgment. The goal isn’t to eliminate subjectivity entirely, but to minimize its influence on the overall score. The rubric should guide judges in using data to inform their subjective assessments.
- Break down big ideas into things you can actually see and count.
- Define score levels: Clearly define what each score represents for each element.
- Provide a common framework: Ensure judges are using the same criteria.
- Balance subjectivity and objectivity: Use data to inform, not replace, human judgment.
Traditional vs. Analytics-Integrated Judging Criteria – A Comparison
| Competition Type | Traditional Criterion | Measurability | Subjectivity Level | Data Source |
|---|---|---|---|---|
| Baking Competition 🍰 | Overall Taste | Low - Relies on descriptive language | High | Individual Judge Palate |
| Baking Competition 🍰 | Balance of Sweet/Salty/Acid | Medium - Can be assessed on a defined scale (e.g., 1-5) | Medium | Panelist Ratings (Quantitative Data) |
| Wine Tasting 🍷 | Aroma Complexity | Low - Primarily descriptive | Very High | Individual Judge Notes |
| Wine Tasting 🍷 | Acidity Level (pH) | High - Measured with instruments | Low | Laboratory Analysis |
| Photography 📸 | Artistic Composition | Low - Subjective interpretation of elements | Very High | Individual Judge Opinion |
| Photography 📸 | Technical Execution (Sharpness, Exposure) | Medium - Can be assessed against defined standards | Medium | Image Analysis Software/Judge Ratings |
| Coding Competition 💻 | Code Elegance | Low - Highly subjective; readability is key | Very High | Judge Review |
| Coding Competition 💻 | Algorithm Efficiency (Big O Notation) | High - Quantifiable performance metric | Low | Automated Testing & Performance Metrics |
Illustrative comparison based on the article research brief. Verify current pricing, limits, and product details in the official docs before relying on it.
Spotting bias with math
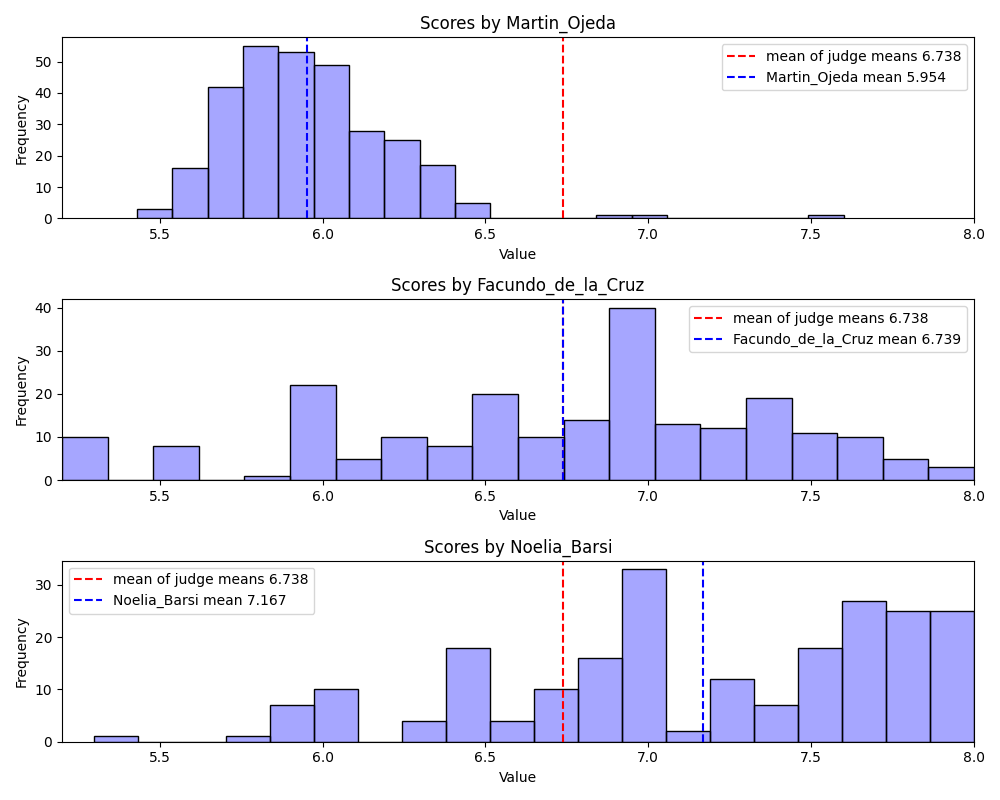
Once you’ve collected judging data, you can use statistical methods to identify potential bias. Inter-rater reliability measures the degree of agreement between judges. If judges consistently disagree, it suggests a problem with the rubric or the judging process.
Standard deviation shows how spread out the scores are. A high standard deviation indicates a lot of variability, which could be a sign of bias. Outlier detection can identify scores that are significantly different from the norm, potentially indicating a subjective outlier or an error in data entry.
Flipped Decisions highlights various factors that can lead to inaccurate scores in judging (flippeddecisions.com). Using statistical analysis to flag these inconsistencies is a powerful way to improve fairness. It doesn’t automatically mean a judge is biased, but it prompts further investigation.
For example, if one judge consistently scores significantly higher or lower than the others, or if their scores deviate sharply from the average, it’s worth reviewing their evaluations to identify potential sources of bias. This isn’t about punishment; it’s about providing feedback and improving the judging process.
Current software and tech
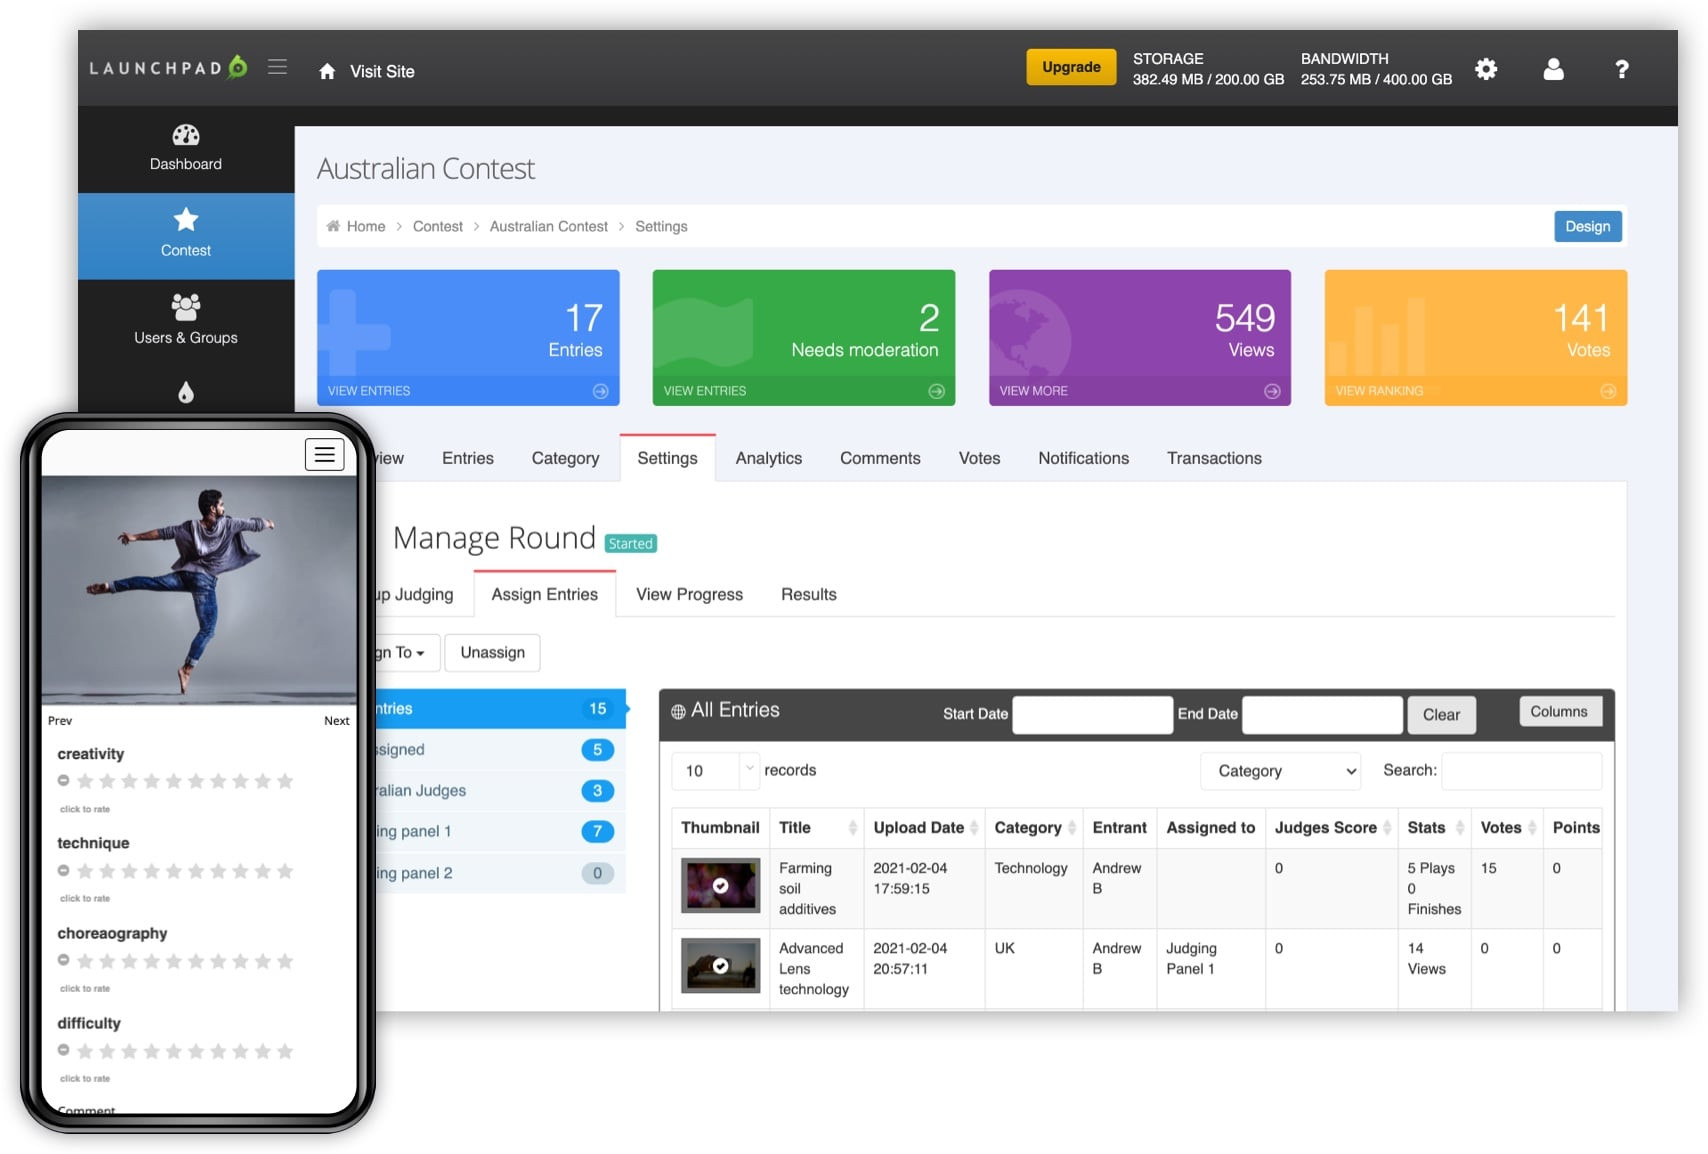
The market for judging and evaluation tools is evolving rapidly. In 2026, we’re likely to see more sophisticated platforms for data collection, statistical analysis, and bias detection. These tools generally fall into a few categories.
Data collection platforms allow judges to enter scores digitally, ensuring consistency and facilitating data analysis. Some platforms integrate with video and audio analysis tools to capture behavioral data. Statistical analysis software (like R, Python with libraries like Pandas and NumPy, or even advanced Excel features) can be used to calculate inter-rater reliability, standard deviation, and identify outliers.
We're also starting to see the emergence of AI-powered bias detection systems. These systems use machine learning algorithms to identify patterns of inconsistent scoring that may indicate bias. However, it’s crucial to approach these tools with caution. They are not a silver bullet and should be used to augment, not replace, human judgment.
It’s important to remember that no tool can eliminate bias entirely. Technology is a powerful aid, but it requires careful implementation and ongoing monitoring. The human element – thoughtful rubric design and well-trained judges – remains essential.
Featured Products

Master data organization and cleaning · Build robust business models · Perform essential statistical analysis
Excel is your go-to for organizing competition data and performing initial analyses to spot potential patterns or outliers that might indicate bias.

Create interactive and insightful data visualizations · Develop compelling dashboards · Effectively communicate data stories
Tableau helps you visually represent judging data, making it easier to identify trends and communicate findings transparently to ensure fairness.

Conduct advanced statistical analysis · Perform hypothesis testing · Analyze survey and experimental data
SPSS is a powerful tool for diving deep into your competition's data, allowing for rigorous statistical tests to confirm objective outcomes.

Learn the fundamentals of R programming · Implement statistical methods · Handle and manipulate data effectively
R offers a flexible and powerful environment for custom data analysis, perfect for developing unique metrics to assess and eliminate judging bias.
As an Amazon Associate I earn from qualifying purchases. Prices may vary.
No comments yet. Be the first to share your thoughts!